


Two years ago, I published the article Ford vs. Ferrari – Brand Power Meets Horsepower and advocated for the long-term ability of Ferrari to compound over time relative to Ford, due to its branding power and corresponding pricing power. At the time, rising inflation was front and center in the minds of Americans, and valuation multiples were contracting due to higher interest rates. Let’s see how the companies have fared since that article’s release.
At the time, I tracked the total return of Ferrari vs. Ford since the 2015 spinoff of Ferrari from Fiat Chrysler until May 20th, 2022, when I finished the article. For a quick refresh, here is that chart1:
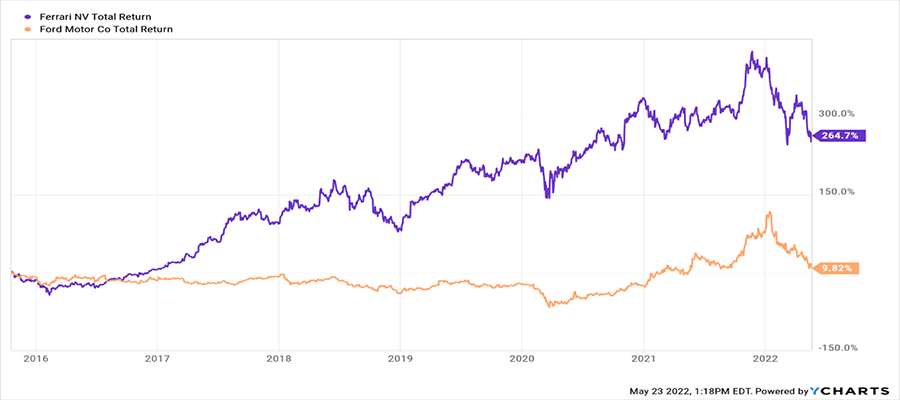
Given this outperformance, many would argue that Ferrari should exhibit some form of mean reversion. Ford traded at a PE ratio of roughly six and Ferrari traded at a PE of roughly 34. With a backdrop of higher interest rates dragging down valuation multiples, we could expect muted performance from Ferrari given their high multiple. Two years later, here is the ongoing performance since 5/20/222:
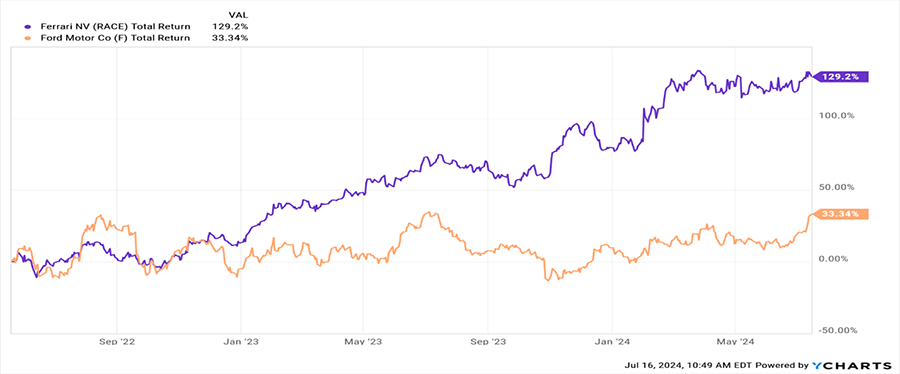
Two years later, Ferrari more than doubled in value with 40% growth in earnings during 2023, a modest dividend, and an aggressive valuation multiple increase driving that return. Ford had an 8% increase in earnings in 2023, a dividend payment of roughly 5%, and effectively no valuation multiple growth until very recently. In another article, Where Do Your Investment Returns Come From?, I argue that over the long term, valuation multiple growth is anemic compared to long-term earnings growth when it comes to driving total returns. Valuation multiples can also amortize downward if stock price growth is lower than earnings growth. It’s a fool’s errand to predict what valuation multiple investors will pay at any given moment. While Ferrari did receive a large boost from valuation growth during this time, let’s investigate previous earnings over time to ascertain any trends. Earnings growth is the true barometer of long-term performance.3
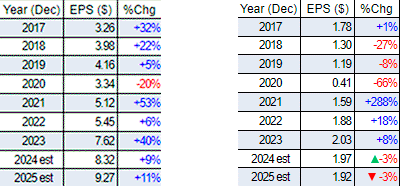
Over time, it’s demonstrable that Ferrari can grow earnings due to the ability to price its cars and invest its excess capital into new models and technology, whereas Ford spins its wheels because it just meets its cost of capital needs. The key is to have excess capital to reinvest. Let’s review each firm’s return on invested capital over time to see where both Ford and Ferrari stand today.4
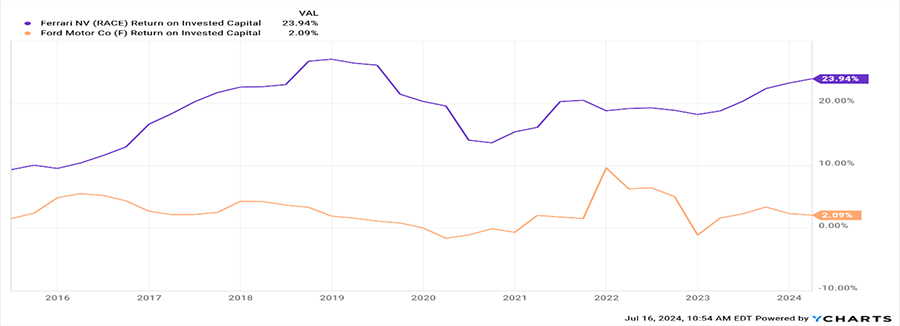
Not once since Ferrari’s spinoff from Fiat Chrysler has it ever earned less on its capital than Ford. A good rule of thumb for equity investors is to demand a company they invest in earn at least a 10% return on their capital, roughly in line with the historical long-term return for the stock market.
Referencing the chart above, Ferrari easily beats that 10% threshold, and Ford has never eclipsed it. Ferrari earns economic profits on its assets, whereas Ford either doesn’t or the margin is relatively slim in higher growth environments. Obviously, the Ferrari customer base is more insensitive to price than the Ford customer.
Summary
Given this is simply a quick check up on the relationship between the two businesses, the dynamics could always be more short-term favorable to Ford or Ferrari. However, in any enterprise, ongoing economic profitability reinvested back into the business tends to drive the sustainable long-term result that equity investors are looking for. There’s no checkered flag when it comes to investing, but if a company can outearn its cost of capital and reinvest, it should be able to lap its competition many times over.
SOURCES:
1. YCharts. RACE and F: Total return (10/21/2015 – 5/20/2022)
2. YCharts. RACE and F: Total return (5/20/2022 – 6/16/2024)
3. MarketSurge. RACE and F EPS with 2024-2025 EPS estimates (7/16/2024)
4. YCharts. RACE and F: Return on Invested Capital (10/21/2015 – 7/16/2024)
Disclaimer: Investing involves risks, and investment decisions should be based on your own goals, time horizon, and tolerance for risk. The return and principal value of investments will fluctuate as market conditions change. When sold, investments may be worth more or less than their original cost. The forecasts or forward-looking statements are based on assumptions, may not materialize, and are subject to revision without notice. The market indexes discussed are unmanaged, and generally, considered representative of their respective markets. Index performance is not indicative of the past performance of a particular investment. Indexes do not incur management fees, costs, and expenses. Individuals cannot directly invest in unmanaged indexes. The author, or the advisor with whom the author is affiliated, has an interest in the securities mentioned in the above article/blog post. The opinions expressed and material provided are for general information and should not be considered a solicitation for the purchase or sale of any security.